


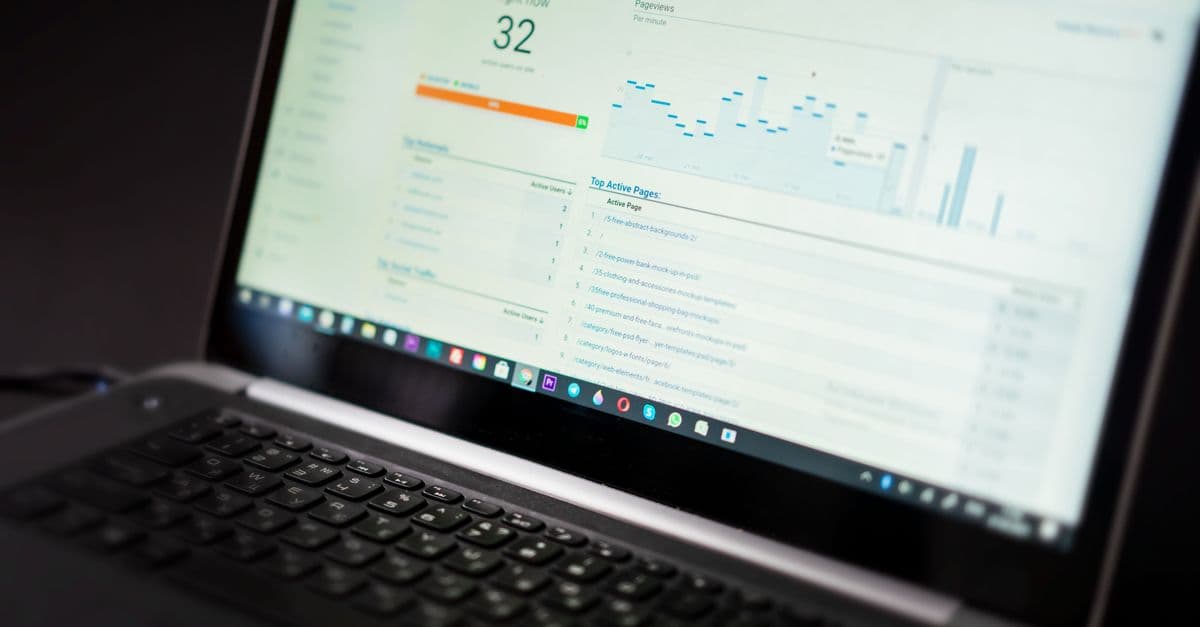
Most dashboards are built to display data, not to drive decisions. They fill up with charts that look impressive in a board pack and change nothing about what anyone does on Monday morning. A dashboard earns its place only when it starts from a decision someone has to make, not from the data you happen to have lying around.
The dashboard that nobody acts on
Every organisation has one. A screen of gauges and trend lines, refreshed nightly, opened in the first week and rarely since. It is not that the numbers are wrong. It is that no one can say what they would do differently because of them. The dashboard reports the weather; it does not tell anyone to bring a coat.
A report describes the past. A decision-support tool changes the future. Most dashboards are the former dressed up as the latter, and the gap stays hidden because a busy dashboard feels like progress even when it drives none.
Why dashboards drift into decoration
The slide from useful to decorative follows a familiar pattern.
Vanity metrics. Numbers that only ever go up and to the right: total users, total orders, cumulative revenue. They feel good and inform nothing, because they never prompt a choice.
No threshold. A number with no target or trigger is just trivia. "Support tickets: 428" means nothing until you know that above 400 you need another agent.
Backward-looking only. Dashboards full of what already happened, with nothing that hints at what is coming. By the time a lagging metric moves, the decision window has already closed.
Too many numbers. A screen with forty metrics respects none of them. Attention is finite, and a dashboard that shows everything hides the two things that matter.
No owner. A metric nobody is accountable for is a metric nobody acts on. If a number turns red and no one's job is to respond, the colour is decoration.
Start from the decision, not the data
The fix inverts how most dashboards are built. Instead of asking what data we have and what we can chart, ask what decisions this team makes each week, and what would change one. Build backward from there.
A dashboard for a warehouse manager exists to answer whether to move staff, reorder stock, or escalate a delay today. Everything on the screen should serve one of those decisions. Anything that does not is removed, however interesting it looks.
What a decision-useful dashboard looks like
One question per view. Each screen answers a single question a specific person is trying to resolve, not a general survey of the department.
A target or threshold on every number. The value is paired with what good looks like, so a glance tells you whether to act.
Leading signals, not only lagging. Alongside what happened, something that gives warning: pipeline before revenue, cycle time before missed deadlines.
An owner and an action. Each metric has a name attached and a clear "if this, then do that," so a red number produces a response rather than a shrug.
A worked example
A services firm built a handsome executive dashboard: revenue, utilisation, headcount, a dozen trend lines. Leadership admired it monthly and acted on it never, because it answered no one's live question.
Rebuilt around decisions, it shrank. The delivery lead got one view: which projects are trending over budget this week, flagged at 80 percent of hours consumed against percent complete. The sales lead got another: pipeline coverage against next quarter's target. Two numbers, two owners, two clear actions. The pretty version informed no decision; the plain version changed three staffing calls in its first month.
Build dashboards that earn their place
A dashboard is not a trophy cabinet for data. It is a tool for making specific decisions faster and better, and if it is not doing that, its polish is a cost rather than a benefit. The test is simple: for every number on the screen, name the decision it informs and the person who acts on it. Anything that fails the test is noise wearing the costume of insight.
If your reports get admired but never change what your teams do, the problem is not your data, it is how the dashboard was framed. Our team rebuilds reporting around the decisions it should drive in a data and operations engagement. Book a discovery call and we will find the numbers your business is collecting but not using.
Frequently asked questions
Why doesn't anyone use the dashboard we built?
Usually because it was built from the data available rather than the decisions people make. If a screen does not answer a specific question someone is actively trying to resolve, they have no reason to open it. Dashboards get used when each view maps to a real weekly decision, carries a target that says whether to act, and has an owner accountable for responding. Without that, even an accurate, attractive dashboard becomes decoration.
What is a vanity metric?
A vanity metric is a number that looks good and informs no decision, typically a cumulative total that only ever rises, like total sign-ups or lifetime orders. It feels like progress but never prompts a choice, because there is no threshold at which it tells you to do something different. Useful metrics are tied to a target and a possible action; vanity metrics exist mainly to be displayed.
How many metrics should a dashboard have?
Fewer than you think. A view should answer one question for one person, which usually means a handful of numbers, not forty. Attention is finite, and every extra metric dilutes the ones that matter. If a screen tries to serve everyone it serves no one; build separate focused views per role instead of one crowded master dashboard.
What makes a metric actionable?
Three things: a target or threshold so you know whether the current value is good or bad, a leading component so it warns you before the outcome is locked in, and an owner with a defined action when it crosses the line. A number without a target is trivia, a number without an owner is ignored, and a purely lagging number tells you only what you can no longer change.